

Truflation January US CPI Forecasts
Truflation January US CPI Forecasts
Preparing for the BLS release.

The monthly US Consumer Price Inflation data for January 2023 is scheduled to be released on Tuesday, February 14, 08:30 ET. In this newsletter, we will dig deeper into the data, looking at the key sectors driving inflation, and provide Truflation’s latest inflation predictions.
The latest US CPI read at 6.5% for December 2022. The market predictions for January CPI range from a hot 6.6% to a very cold 5.8% with the market consensus at 6.2% for the YoY inflation rate, 5.5% for the core CPI, and 0.5% for the MoM.


Recent trends
Recent downward inflation trends have been broadly encouraging, especially the easing of utilities, food, and transportation costs providing some relief to the consumers.
However, concerns remain. In recent months, we have started to see some categories increasing month-over-month with the wage growth pushing costs higher, while the most recent jobs report highlighted that the labor market remained strong.
Looking ahead
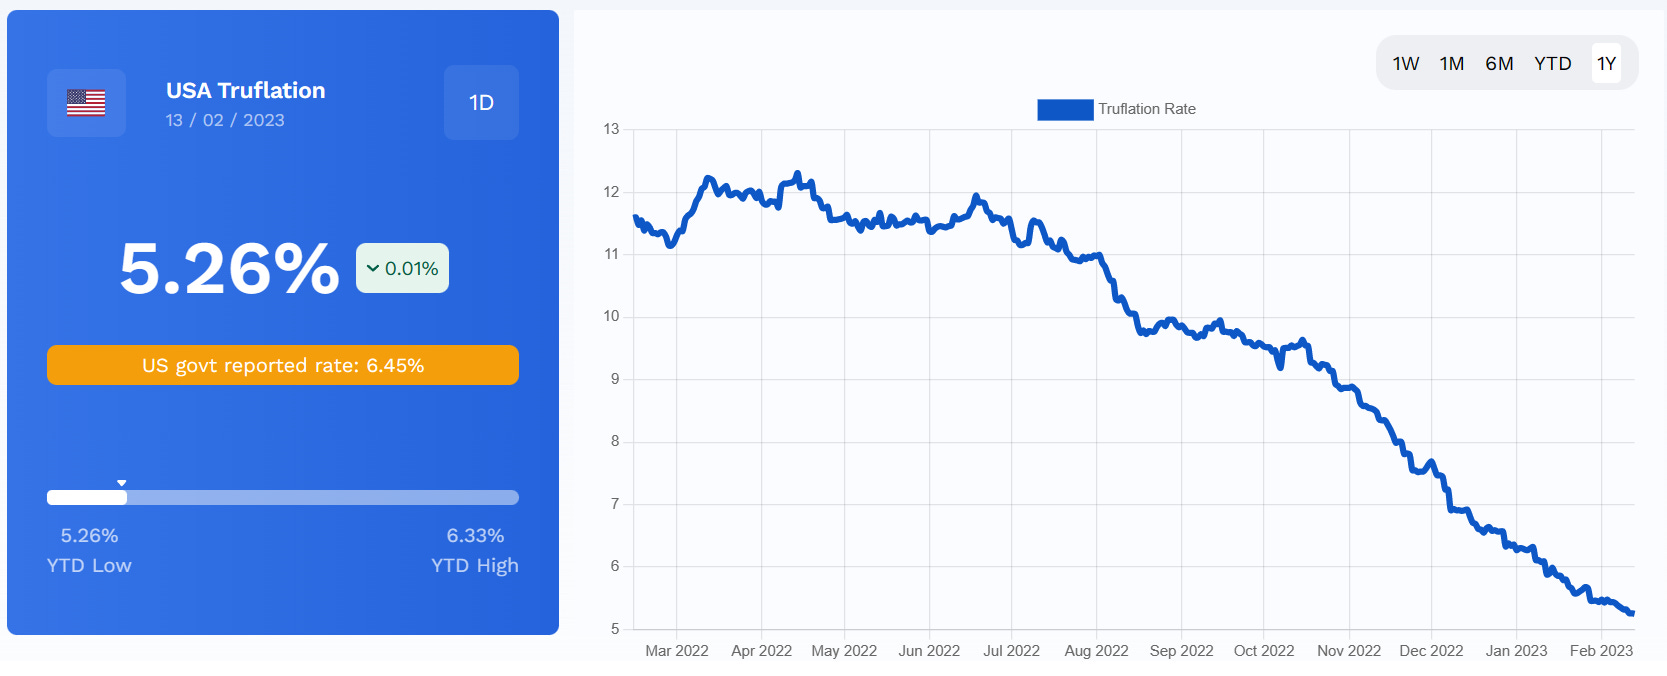
Despite some recent uptrends, Truflation is predicting that the January CPI release will see inflation continue to cool significantly.
We expect the number to come in at 5.8% year-over-year, marking a significant drop from 6.5% YoY in December 2022, while month-over-month inflation is forecast to come in at +0.2%.
It is worth noting that this month, the Bureau of Labor and Statistics has updated the methodology they use to determine the relative importance of each category to the average American household expenditures.
In 2022, each category’s weight in the CPI was calculated based on the average of the BLS 2019 and 2020 annual consumer expenditure surveys. This year, the BLS is using data from the 2021 survey to determine the relative weight of each category in the index.
While this is not expected to impact the numbers in a radical way, the change is likely to affect the accuracy of the forecasts due to the short-term uncertainty it creates. More readouts will likely be needed to appropriately assess the differences between the Truflation index and the changed BLS CPI to forecast the inflation in the future.
For a full explanation of our forecast rationale listen to our data team Twitter Spaces ahead of the CPI release. 👇
Housing, a key driver of the downward trajectory
Housing, the biggest contributor to household expenditure, has seen prices decline continuously over recent months, down 1% month-on-month from December to January, according to Truflation. This downward trend has been driven by both rented and owned accommodation.

Since July 2022, average home prices have been falling, according to US census department data, while the share of listings that have seen a price cut has increased to 22%, according to Zillow. Coupled with the Fed’s interest rate hikes, this is having a cooling effect on house prices.
However, due to the statistical lag in the BLS data, there is a significant discrepancy in the trends between the BLS Shelter index and the Truflation Housing index. The Truflation index is composed using data from seven different data partners. The chart below demonstrates the delay, where the month-over-month percentage change for the BLS shelter index (in blue below) has been fairly between 0.6% and 0.7% till December 2022. In comparison, Truflation (in red below) had a eerily similar trendline till July 2022 and then saw a strong downward trend.

Currently, the lag in the BLS housing data is around five months compared to the Truflation data, suggesting that the downward trend in housing costs will begin to come through in the BLS data in the foreseeable future.
Since housing is the single largest weighting in the CPI report, this will have a significant impact on the overall numbers. In turn, this will offer some further reassurance to the Fed and the market that inflation is, indeed, getting close to the central bank’s target.
Utilities, Communication, and Clothing are declining
Utilities are another contributor to lower inflation, with costs coming down across the board but driven primarily by the falling costs of electricity, which makes up the biggest portion of the utilities spending.
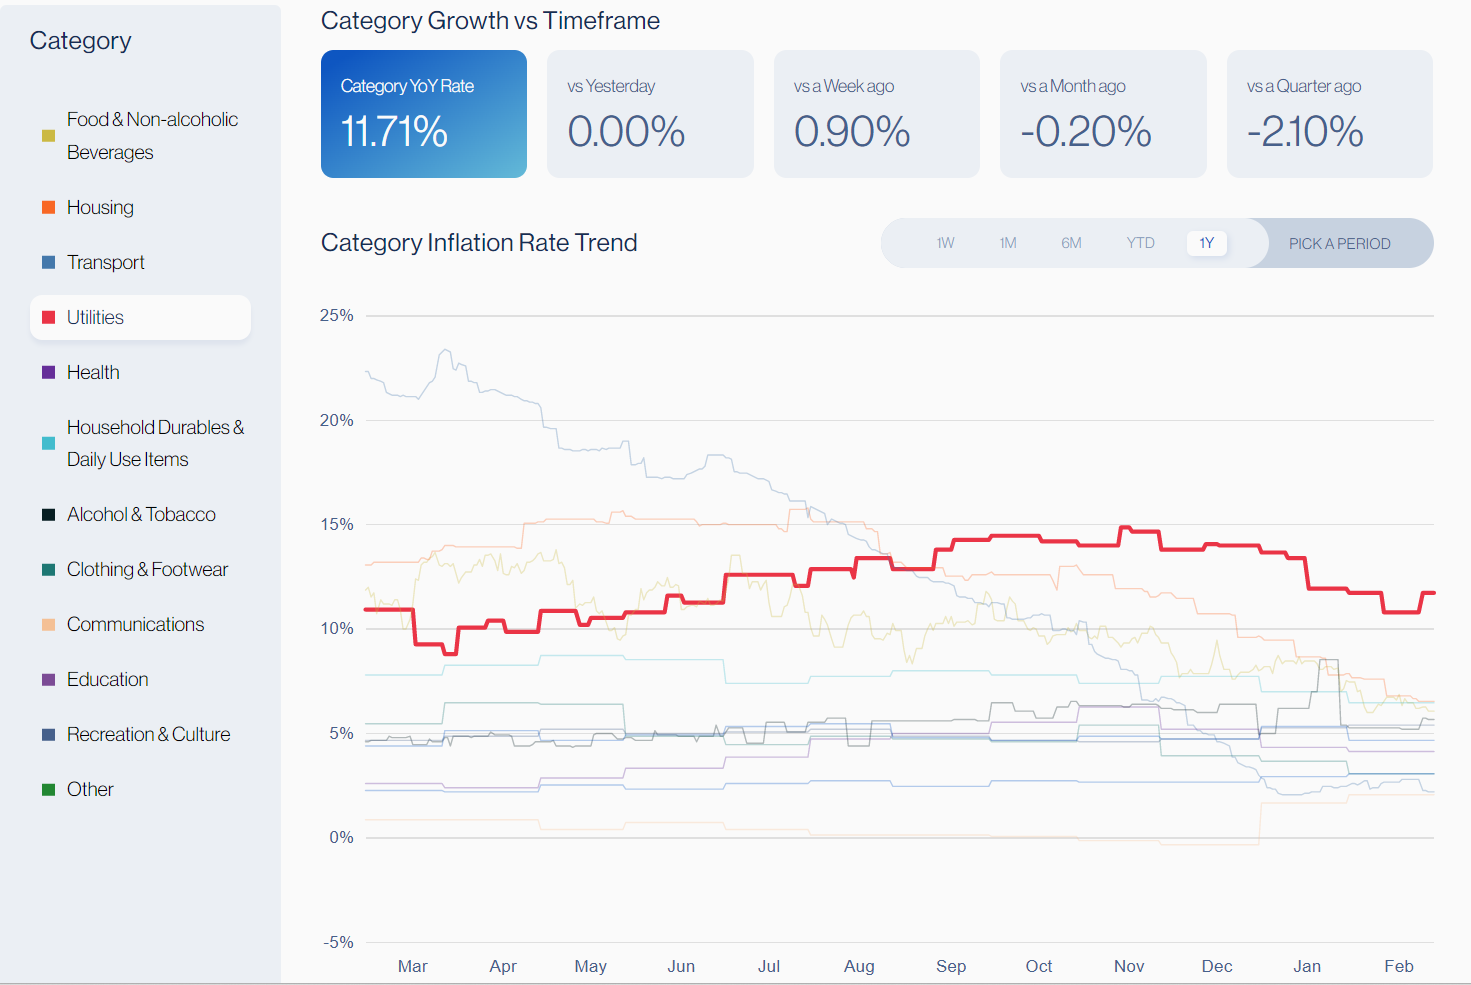
Meanwhile, the Clothing and Footwear, and Communication categories have also declined month-over-month by 1.8% and 1.1%, respectively.
Food costs keep rising
Food prices are continuing to increase month-over-month, rising 0.8% between December and January, even though on an annual basis, price changes have nearly halved from 14.5% to 7.4%. The monthly increase is driven by ongoing price rises for food purchased for home consumption, as opposed to dining out. The food category holds a heavy weight in the index, so price rises here are especially painful for consumers.
Within this category, egg prices have increased more than 60% compared to the same time last year, while the price of butter is up 31%, for example. As a result, more than 1 in 5 consumers have been forced to buy groceries at dollar stores, according to Coresight Research. In fact, dollar stores are the fastest-growing food retailers, in part because they are expanding at a significant pace in rural areas, according to a separate study published in the American Journal of Public Health. Rural areas, which are often the most affected by inflation are also excluded from the BLS CPI, which covers mainly the large cities.
Meanwhile, alcohol prices are also up 2% month-over-month between December and January. This is a seasonal increase seen every year during the Christmas period, so these costs can be expected to drop again in the coming months.
Transportation costs are on the up
The total costs in the Transportation category have increased by 0.3% month-over-month, despite the year-over-year numbers going steadily down. The monthly drop could have been caused by supply constraints combined with the increased sale of new cars. In particular, electric vehicle adoption in the US has increased markedly, with more than 20% of new cars sold in 2021 being electric, according to Statista.
As US consumers purchased more vehicles, they have also been taking out more auto loans, with the total value of these reaching $1.5 trillion and the average debt burden sitting at $14,469, according to the Federal Reserve Bank of New York. As a result, it is not surprising to see car financing costs increasing in other vehicle expenses subcategory.
Used car sales, however, have declined, which is a common trend during the winter months.
Fed rate expectations
After raising rates by another 0.25% in February, the Federal Reserve is expected to make a similar move during its March FOMC meeting. The biggest uncertainty now is around the decision the central bank will make in the May whether to continue or pause the hikes, based on the inflation data.
The strong January jobs report and a further decline in the CPI numbers could mean that the next interest rate hike will be the Fed’s last. However, if the Fed doesn’t see prices dropping as fast as they would like, this could justify another rate hike in May.
About Truflation
Truflation provides a set of independent inflation indexes drawing on 30+ different data partners/sources and more than 12 million product prices across the country. The indexes are released daily, making it one of the most up-to-date and comprehensive inflation measurement tools in the world.
Truflation has been leveraging its measurement system to predict the BLS CPI number. In the last three months, Truflation’s predictions have been spot on for two months and 20 basis points off for the third, highlighting its strength as a measurement tool combined with a comprehensive model to predict the CPI number.
Check our new dashboard at truflation.com and let us know what you think.
Quality data and insights. I can see you guys being an actual key piece in up-to-date information instead of quarterly reports.
Keep the good job team!